DataMiningGraphics
![[DataMiningGraphics line logo]](nl.gif)
Today's data bit
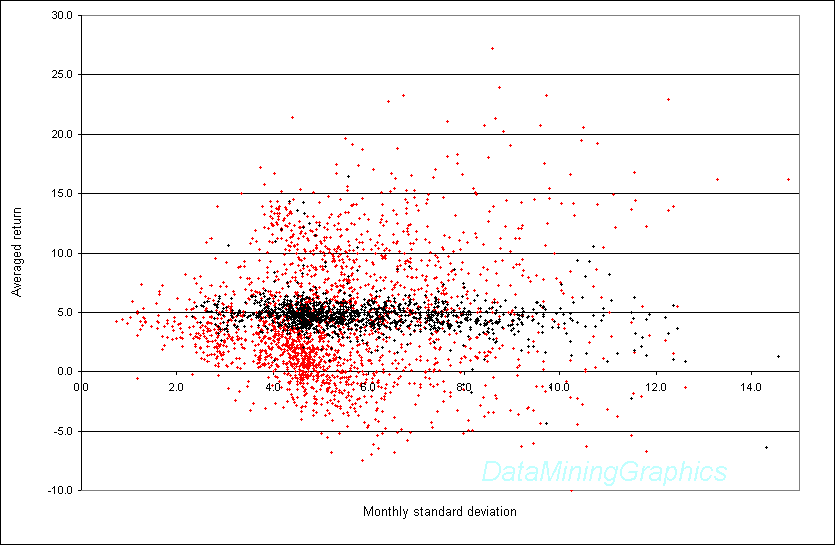
... looks at the relationship between risk, as measured by the standard deviation of the month to month returns, and a fund's averaged trailing return over the last eight years.
For the graph, equity funds are depicted in red and bond funds in black.
DataMiningGraphics provides data and analysis on a "as is" basis. Analysis of historical data does not imply that future results will be similar, as market conditions can and will change in unanticipated ways. None of the analysis or statements made by DataMiningGraphics should be construed as financial advice for the sale or purchase of mutual funds; therefore, any investment decisions that are made or investment strategies that are utilized by any user of the products offered by DataMiningGraphics are done so at the sole discretion and risk of the user.
