| Home |
Correlations | FAQs | Products & Services | Daily Data bit | Past bits | Contact |
| Home |
Correlations | FAQs | Products & Services | Daily Data bit | Past bits | Contact |
| Subscriber login Our privacy policy |
DataMiningGraphics provides alternative methods on the analysis of the expected returns and risks of owning mutual funds. The analysis provided is meant to complement, rather than replace, the information you can get with any of the larger services such as Morningstar , Google, Lipper, Yahoo! or Value Line Publishing. |
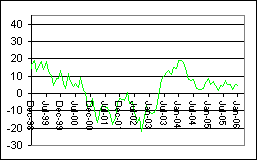
Historical trends of 1 year- 1 year averaged current returns  | |
| Thank-you for visiting this site, but it is currently being constructed. Please come back in the near future! | ![[equity and bond fund lines]](bndequit.gif) trailing returns averaged current returns averaged returns |
![[S&P500 line]](SP500.gif) trailing returns averaged current returns averaged returns | |
| Feature | DataMiningGraphics | Competitors | |
| Screening method | Weighted selection criteria that allows the retention of hits that would otherwise be discarded due to being outside the limits of one or more screening criteria | Typical screening by setting min/max limits on selection criteria | Free product samples are available for downloading |
| Visualization | Colored gradient from red to blue to indicate where the fund scores for that criteria | Monochrome stars, numbers, etc | |
| Rating | Highest and lowest scores depend on the data. Occasionally no funds will receive the highest rating since the top funds are not all that different from those that follow. | Arbitrary cut-off for the highest and lowest rated funds. Typically set at the top and bottom 10% | |
| Risk | Many measures including Monte Carlo survivability simulations, maximum/median loss, median years for a 5% gain | Several measures, such as beta, standard deviation, largest quarterly loss | |
| Return | Many measures including averaged trailing returns, discounted returns, enhanced returns | Several measures, such as 1-,3-,5- year trailing returns and Bull /Bear markets, alpha | |
| Software | All software updates and any future enhancements for a product line are free! |
| to top |